| To plot files on a surface 1) create a label file if none exists, 2) create a scene with the surface, 3) optionally load a picture if you are plotting off an image and 4) place points on the surface. |
 |
The first step to plotting points is to create a label file.
- Select a folder node in the Library tree (like Magnet/P117/Structural/Labels)
- Click [Add] and select New File at the top.
- Choose "Labels" under Select Type. If labels does not appear it is because you selected a folder that does not accept label files.
- After you click [Create new data], you will see a new file called "New Labels" in the tree. To change the name select New Labels and go to the [Data] menu and click "Info." You can now change the name in the Name field at the top.
|
After we have a file in which to store the points, we need to create a scene with a 3D surface on which we would like to plot.
- Select Magnet/P117/Structural/Surface/Cortex/Cortex in the library tree and click [Show].
- If you have veins, arteries or other landmark data, you should add them to the scene now. For veins select Magnet/P117/Structural/Surface/Veins/Veins in the library tree and drag it onto the 3D scene.
- Select the new label file that you created in the previous step and then drag it onto the Cortex scene. You should now have the Map file under the [Data] tab.
|
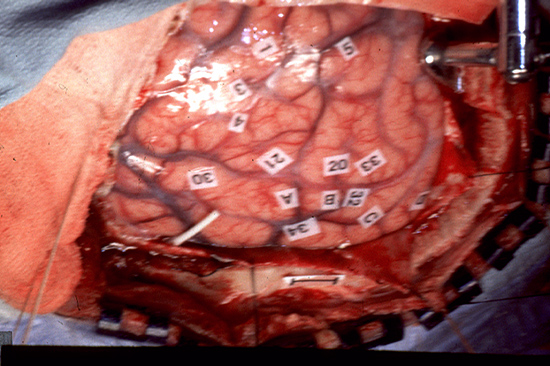
If you are mapping from a photograph, you probably want to load it so that you can view the images side by side.
- Start by loading the photograph (Select the photo and click [Show])
- To view the scenes side-by-side, you will need to change the layout. Go to the the [Edit] menu and select "Preferences" (on Mac, look under the Application menu for "Preferences"). Under Layout select "Multi Window." You can now arrange each scene how you like.
Tip: to go back to a single scene view, go to "Preferences" and select "Single Window."
|
 |
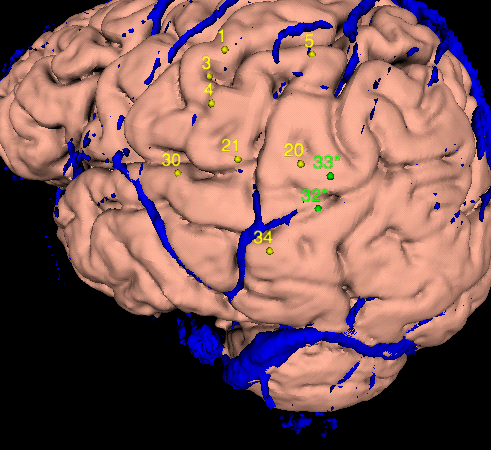
- On the 3D scene, you will need to rotate the brain to the appropriate angle. Do this either by clicking and dragging the image or by going to the [View] tab, selecting "View" and clicking on the arrows and buttons to adjust the scene (you can change how much by clicking on the text box in the middle and entering another value).
- To plot points you wll need to go back to the [Data] tab and select your labels file in the drop down. To enable editing of this file click on the [Edit] button. The cursor will now place points and [+] and [-] are enabled.
- To add a point click [+] and then click on the cortex where you want the point to be.
- You can change the label by double clicking on it in the table in the [Data] tab and typing a new name.
- If the placement of a point is off, you can move it by clicking on the point and dragging it to the new location.
Tip: If you are going to be placing several points, turn on Auto Add to eliminate clicking [Add] several times
|