The architecture and data sources for the DXBrain system are described in our
current progress report. Many of the features
of that system are demonstrated by the following query:
Find all female patients who made a semantic naming error during cortical stimulation mapping (CSM). For each of these patients find all CSM stimulation sites where at least one such error was made and that are located in the temporal lobe of the brain. For each of these sites return the normalized 3-D coordinates so that they may be compared. In addition, for each patient with at least one such error, return the associated fMRI study that was done using the same object identification protocol, if there is one.
This query is saved in our current demo system.
It should be noted that for the general public this query only accesses a small subset of the patients in our database, so no meaningful neuroscience conclusions can be drawn. The query is only meant to demonstrate the potential of our tools, and in fact only a single public patient satisfies the constraints of the query. Thus, the results of this query tell us nothing about any relation between cortical stimulation and fMR changes, or their relation to patient characteristics such as gender. As our database becomes more extensive, these and similar issues can be examined by simply rerunning the query on the larger dataset.
The query accesses these sources: the CSM database, the fMRI database, the FMA, and the transformation server. To demonstrate the query first click the above link in a new window so you can follow along with these instructions. Then click the XML, HTML or CSV buttons to execute the query and see the results in any of these generic formats. Clicking on the Image2 button displays a schematic of the brain with the anatomical location of the (single) retrieved stimsite colored.
If you have Java web start installed (which comes with any recent Java installation) you can click on the 3D button to see the results in 3-D. In this case a new page will come up, with a drop-down menu asking which normalized brain the retrieved results should be displayed on. The two selections with asterisks are canonical brain atlases, and will cause our display program MindSeer to run in standalone mode on your desktop. In the process of setting this up webstart will automatically download the appropriate version of Java3D, which will often be able to take advantage of the rendering capabilities of your graphics card, and will therefore permit real-time interaction.
To try this select the first option, Average Gray*, and click “Show It”. If Java web start is correctly installed you should have the option to execute the resulting jnlp file. Doing so should, after as much as a minute the first time, bring up MindSeer with the Montreal Average Brain loaded, and the single stimulation site retrieved by the query shown as a large blue dot. An error dialog will come up saying the system can’t find the retrieved header file. This is because that file is not located on your desktop, but rather on our server. Click OK to dismiss the error dialog. You can then use the mouse to rotate the brain in real time. You can also play around with changing the color of the brain, the size of the displayed dot, and its color.
The same data can be displayed on a more realistic canonical brain by clicking Colin* and executing the resulting jnlp file. Again, this version will run in standalone mode, allowing real-time interaction, but not allowing the display of the fMRI data.
If you want to display the retrieved fMRI data as well as the retrieved CSM data, select the Colin(Remote) option. This will run MindSeer in client-server mode, in which most of the work is done on the server, and a thin Java client only shows 2-D snapshots of scenes that are rendered on the server. In this case the server knows where the fMRI files are located, and when MindSeer comes up after executing the jnlp file it will be initialized to show the retrieved fMRI file in three orthogonal views. To see the Colin surface click the “surf_colin” tab at the top of the MindSeer display. This will show the Colin surface atlas. Use the mouse to rotate the atlas so the left side of the brain is showing, aloing with the blue dot representing the retrieved stimulation site. Note that the interaction is slower this time because MindSeer is operating in client-server mode, but the display looks exactly the same as in stand-alone mode.
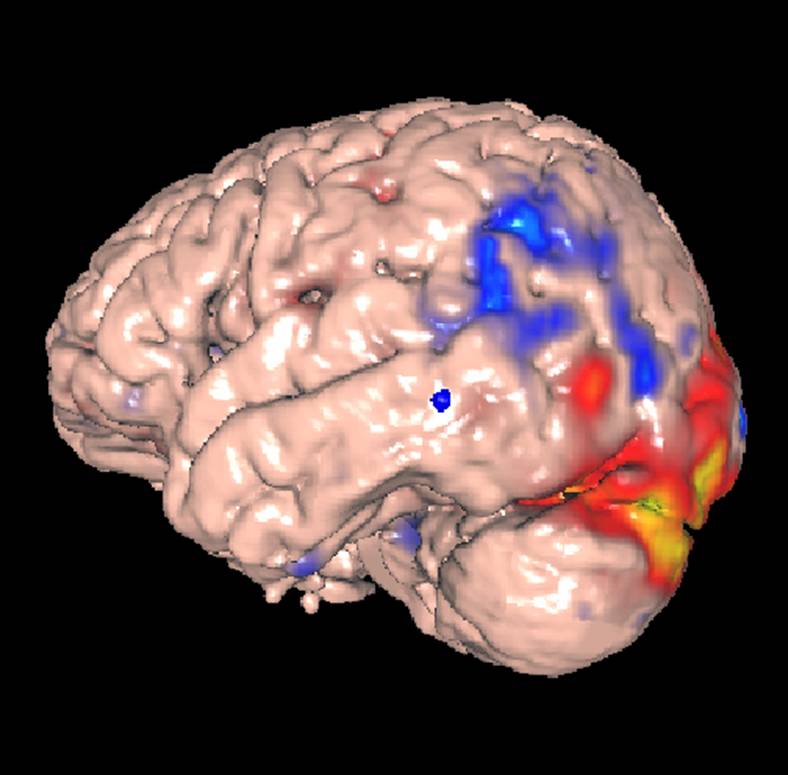
To combine the fMRI data with the CSM data go to the right-hand side of the display where it says “Results Map” under the “Data” tab. Select “Colin MNI Surface”, which will cause the panel below this selection to show a set of controls for altering the appearance of the Colin MNI Surface. Under the bottom “Surface Data” sub panel, click “+ Add”. This will bring up a small portion of the same library display as is shown in the left side of the screen. Open up successive levels of this hierarchy until you get to “C2-C1 Sess 2”, which is the retrieved fMRI file. Click on this file. An error dialog will come up because some of the data are missing. Click OK to dismiss this file. You should then see an image that looks something like this:
in which the surface is colored according to the intensity of the fMRI volume, where blue is decreased brain activity and red is increased. Again, note that this is only a demonstration on a single patient, so no neuroscience conclusions can be drawn.
The key point of this demo is to show that data from separate data sources (CSM and fMRI in this case) can be retrieved and displayed on a a canonical brain, thereby permitting multimodality data to be integrated in order to gain a better understanding of brain function than could be obtained from a single modality alone.